
Sugar, Flower, Fish or Gravel - Now a Kaggle competition
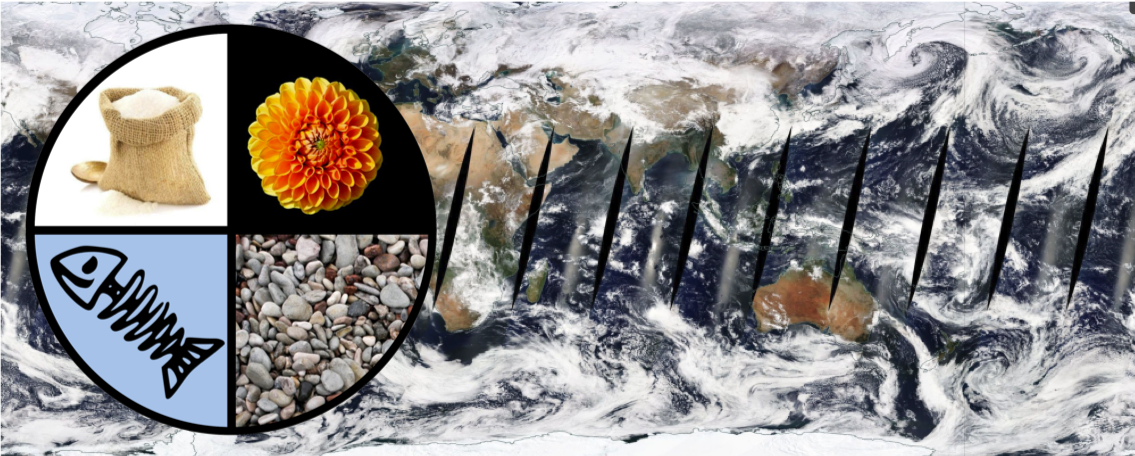
I am very happy to announce the launch of our Kaggle competition “Understanding Clouds from Satellite Images”. This competition is the culmination of literally hundreds of hours of human labor from dozens of scientists. The challenge is to segment satellite images into one of four classes. Typically, when we think about different cloud types we think of cumulus, stratus and cirrus. The four classes in this challenge, however, are called Sugar, Flower, Fish and Gravel. So, what the heck are those?
It all started around two years ago at a workshop where 12 cloud experts came together to discuss shallow clouds over the ocean. These clouds look benign compared to big thunderstorms but, in fact, for the Earth’s climate they play a huge role. The reason is that they reflect a lot of sunlight back into space, thereby cooling our planet, while only contributing marginally to the greenhouse effect. This means that it’s really important to figure out how these clouds will change as our planet warms. Current climate models, however, struggle with that. They do not even agree whether there will be more or less of these shallow clouds.
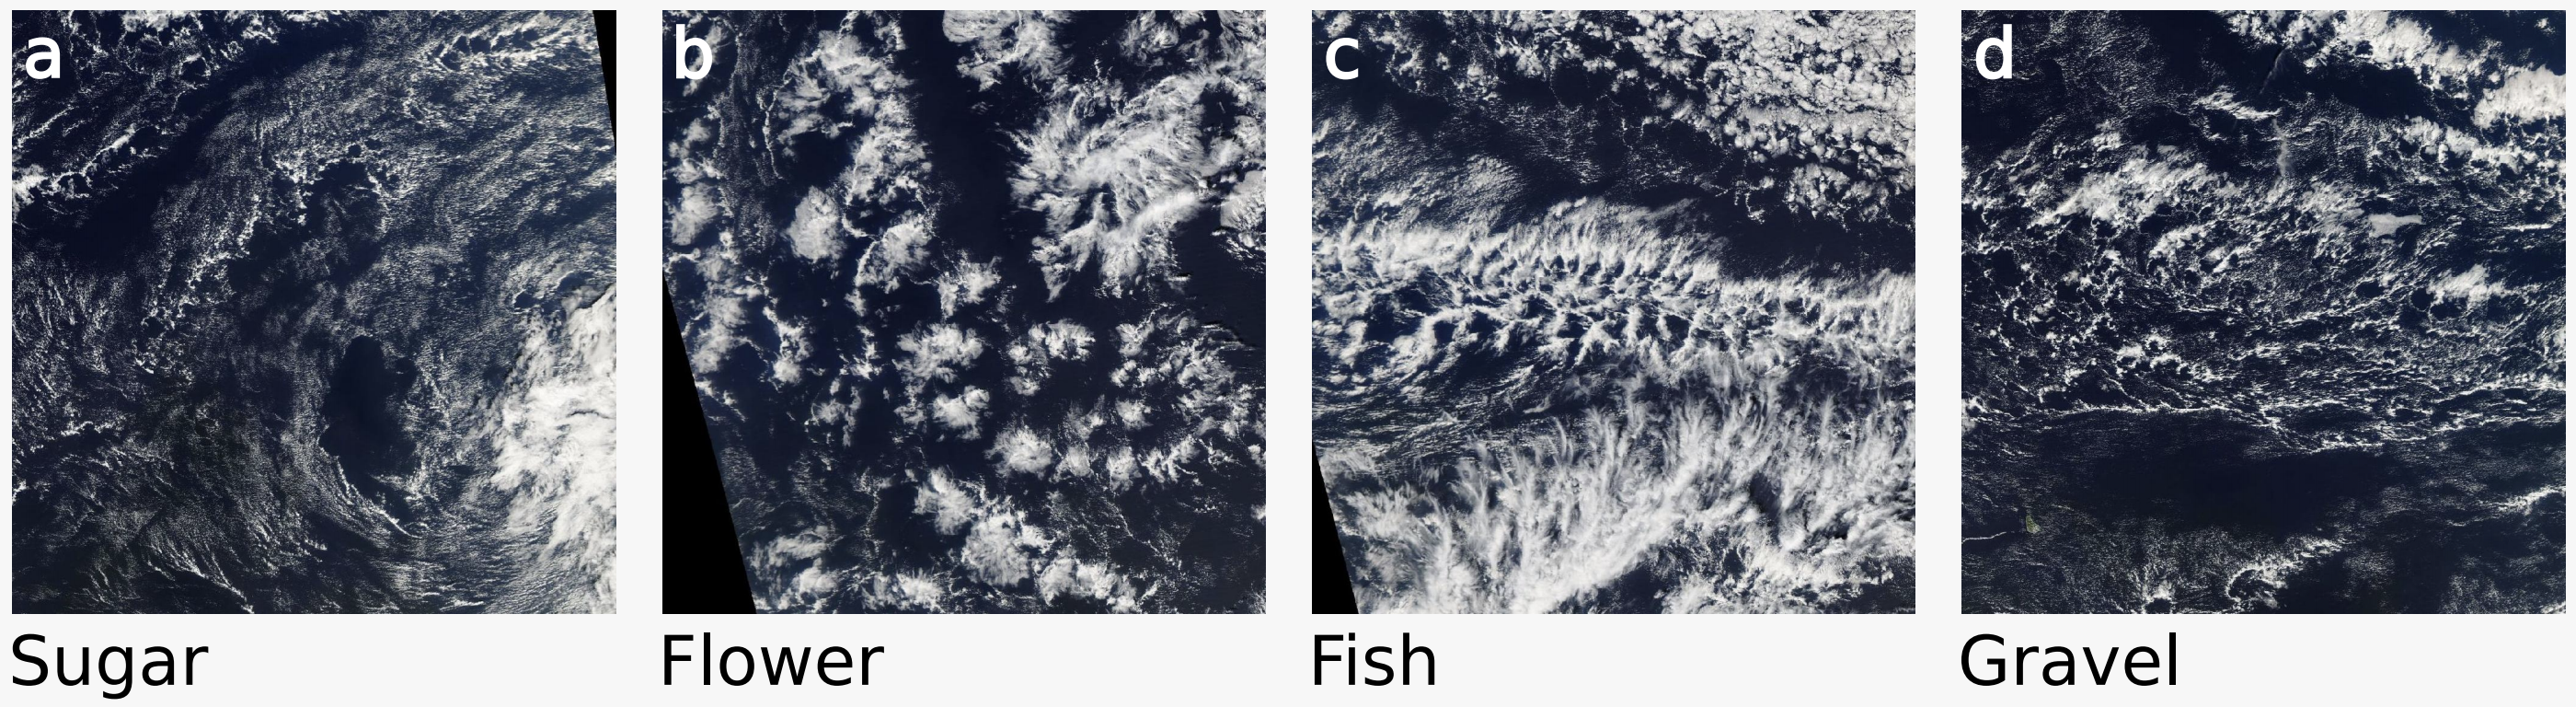
Part of the reason is that shallow clouds aren’t just the result of the global circulation of the atmosphere. Rather, they have a life of their own and arrange themselves in a variety of patterns. For many of these patterns, the basic mechanisms behind them are poorly understood. This brings us back to our group of scientists. As they were looking through hundreds of satellite images like the ones shown on this page, they noticed that some structures occur more often than others. After some discussion, they agreed on four common patterns and called them Sugar, Flower, Fish and Gravel.
To find out more about these four patterns we needed more data. And to get that data we set up a crowd-sourcing project on Zooniverse, a platform where scientists can create their own labeling interface. For our project we went to NASA Worldview and downloaded 10,000 satellite images from three regions over the Atlantic and Pacific where these cloud patterns occur frequently. On the Zooniverse interface, users are shown a random image and are asked to draw boxes around the cloud structures.
In November of 2018, we organized cloud labeling days at the Max-Planck-Institute for Meteorology in Hamburg and the Laboratoire de Météorologie Dynamique in Paris. There, the whole department, around 70 scientists in total, spend an entire day labeling over 30,000 images in total. This means that for every image we have labels from three people.
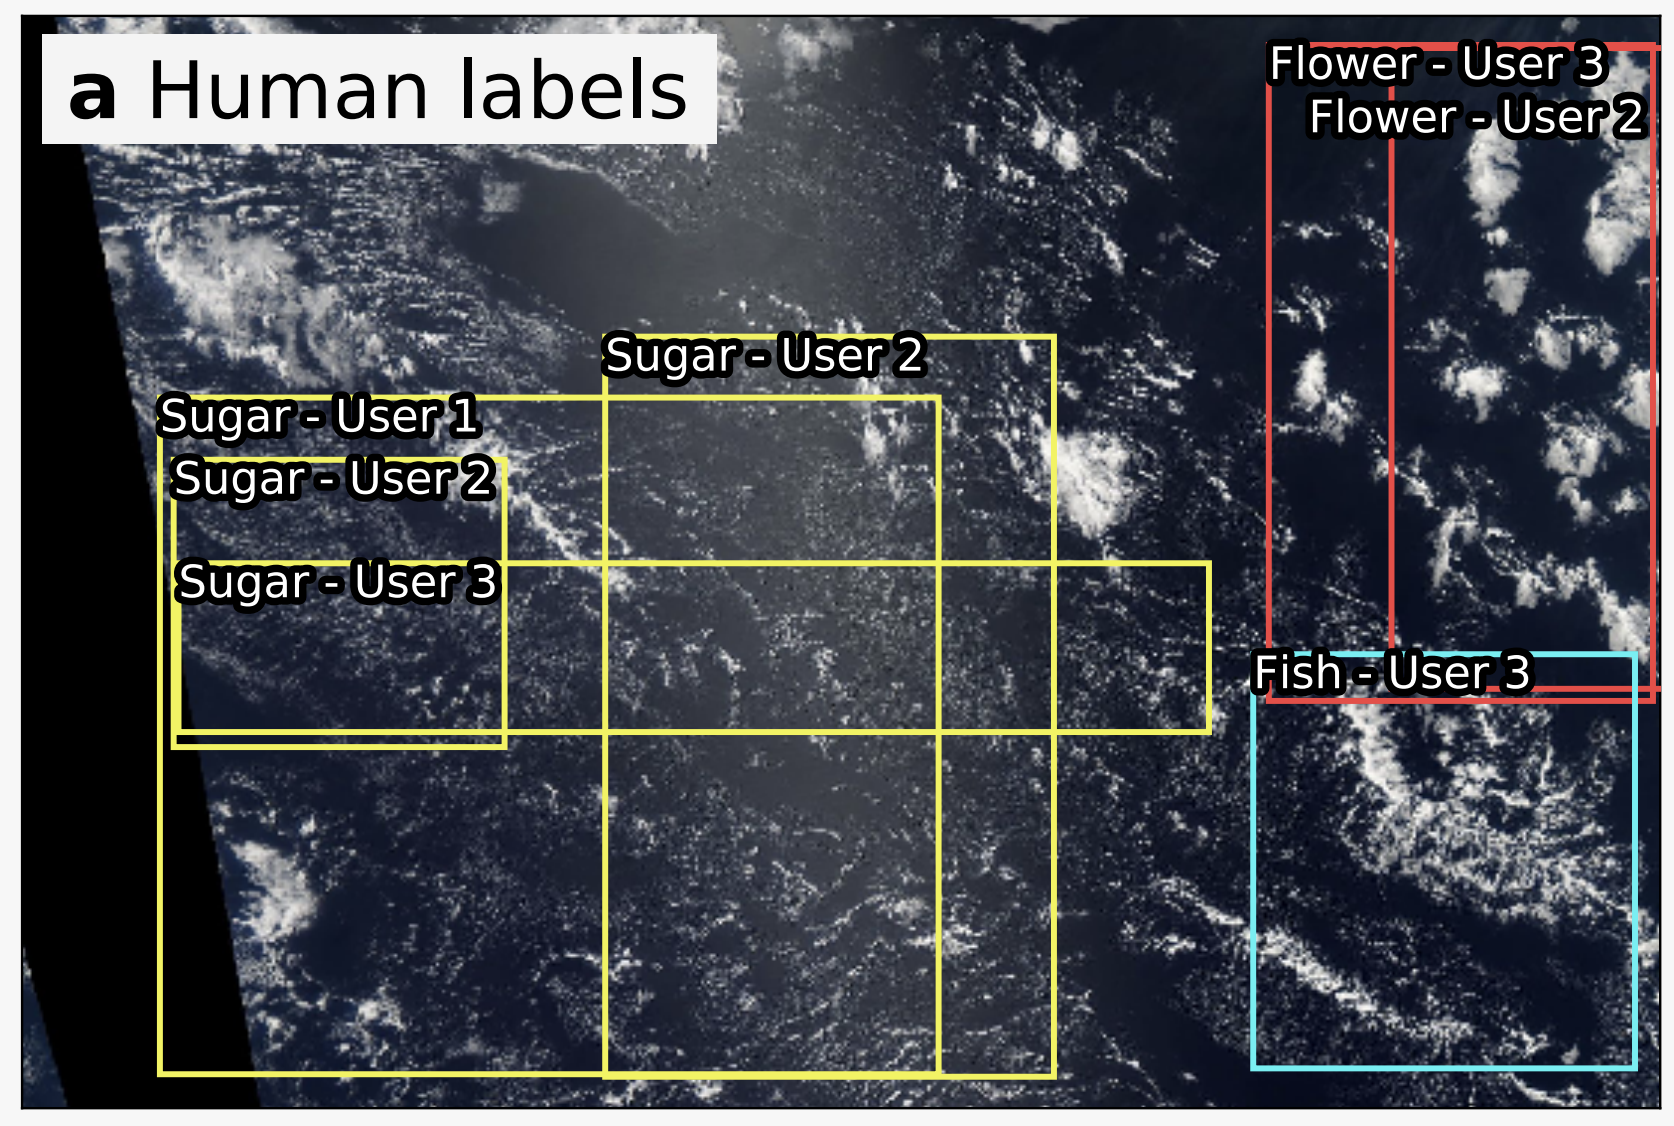
Part of what makes this project interesting is that the labels are subjective. One person’s Sugar might be another person’s Gravel. In other words, there is no objective truth. The first question, we can ask then is to what degree people agree on the classes. It turns out that people agree on around 40% of the labels. This might not seem much at first, but remember that this is a highly subjective task. Viewed from a different perspective, there is an 80% chance that at least one out of three people agrees with your judgement.
Now that we have this large hand-labeled dataset, what can we do with it? To start out, we can analyze the physics behind the cloud patterns by checking how their occurrence correlates with the large scale flow. But despite an accumulative 250 human hours spent labeling, the data only cover a small fraction of the global for a small fraction of time. We would like to scale up our analysis and deep learning is the perfect tool for that.
For this reason, we now challenge the Kaggle community to build a machine learning model based on the human labels. With such an algorithm we would be able to extend our analysis to different parts of the world. We really look forward to seeing what approaches to pre-processing and model building the Kagglers will chose.
Apart from obtaining a good predictive model, we also hope to raise awareness of the types of questions climate scientists deal with on a day-to-day basis. In the end, we would like to produce better forecasts but to do so first requires a better understanding of the physical processes in the Earth system. Understanding how clouds organize is one such example. We hope that modern machine learning techniques will accelerate our research in ways previously inaccessible.
Finally, I would like to thank everyone who made this possible: Hauke Schulz, Sandrine Bony, Bjorn Stevens and, of course, all the cloud labelers!
For a preprint of the paper describing the crowd-sourcing activity and more about the scientific background, click here.
The crowd-sourcing platform is still up and running. So if you want to try labeling some clouds yourself, click here.
Finally, this is the Kaggle competition.
Leave a comment