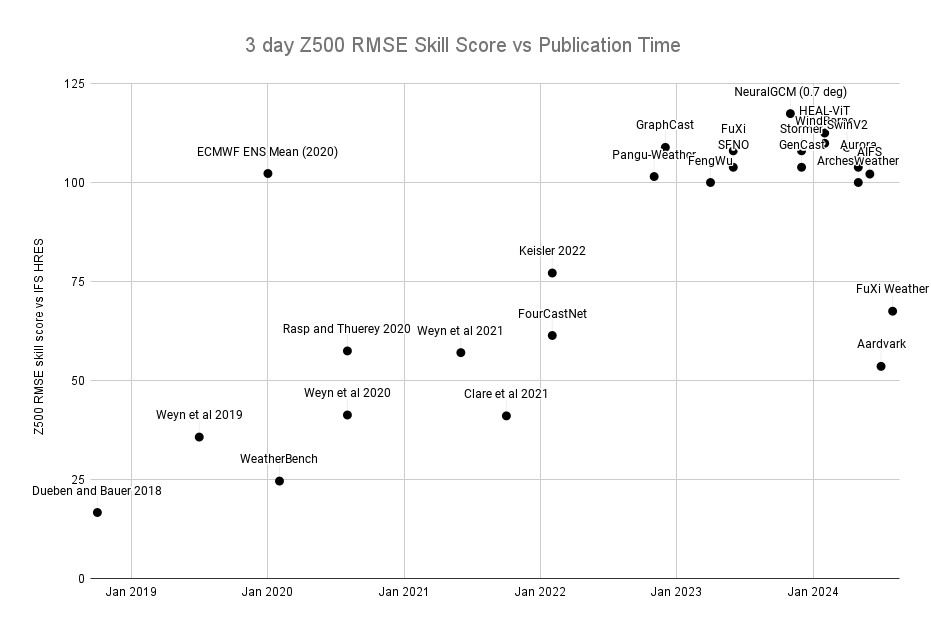
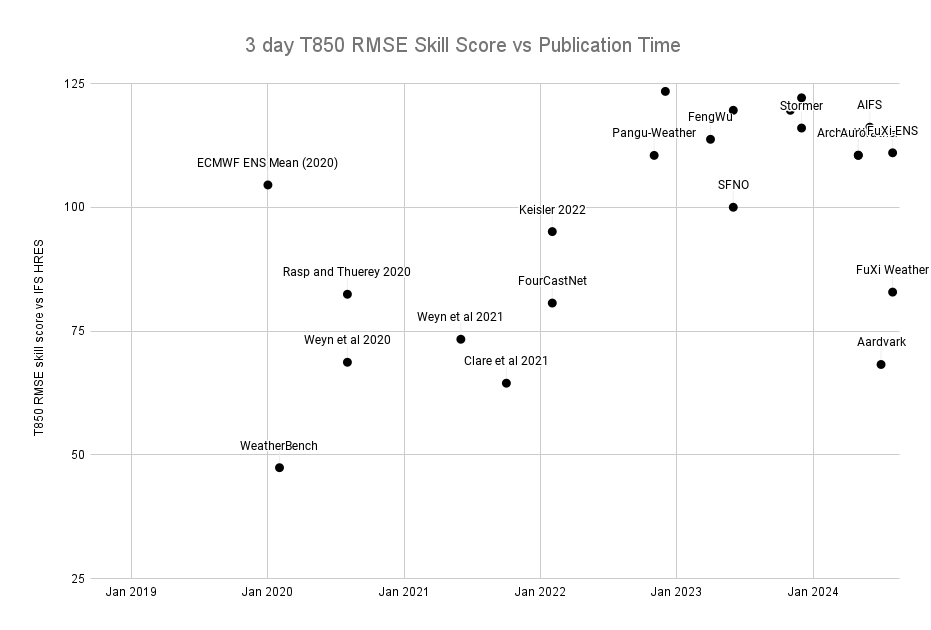
Progress of AI-weather models over time
Below are two charts showing the progress of global AI-weather models over time, for 500hPa geopotential (Z500) and 850hPa temperature (T850). The purpose of these isn’t to provide an exact scoring of which model is best (see caveats below) but rather to give an overview of the overall progress of the field.
- 3 day scores are chosen to minimize the potential confounding effect of blurring on RMSE metrics (at 3 days HRES RMSE is roughly equal to ENS mean RMSE).
- Ideally, we would look at probabilistic metrics but, so far, the vast majority of AI-weather models are deterministic only.
- Upper level variables are chosen since for those (re-)analysis is a solid ground truth. For surface variables like temperature or, god forbid, precipitation, the choice of ground truth (analysis or observations) matters more.
- For models that are not on WeatherBench 2, the scores are an estimate. I used HRES scores, where reported, as a reference. Since evaluation methodology differs, the HRES scores can also vary.
- In addition, the evaluation year might also differ between models (WeatherBench 2 uses 2020 as its eval year), and some models are initialized from operational analysis, others from ERA5.
- This also means that the HRES reference is typically ~4 years old. ECMWF’s skill progression charts suggest that upper level skill has been roughly constant over that period but still this might be a small disadvantage.
- All this means that a mental error bar of +/- 10% should be added to the plots.


Here is the link to the spreadsheet that includes the raw numbers and links to all sources. If you find an error or have a suggestion, please don’t hesitate to add a comment in the sheet.

Leave a comment